posit::conf is September 14-16 in Houston, TX! Register now to attend in person or virtually.
ggsql 0.4.1 adds support for spatial plotting and data aggregation within layers. Read all about the new features in this release post
webR 0.6.0 has been released, bringing the latest version of R, updates to the LLVM and Emscripten toolchain, additional system libraries compiled for WebAssembly, and bug fixes

querychat now supports ggsql-powered visualizations — users can ask “show me” questions and get charts rendered directly in the chat, alongside SQL queries and reactive filtering, all without arbitrary code execution
Posit’s Python libraries provide excellent support for Polars DataFrames across your data science workflow
An installable skill that helps coding Agents produce consistent, runnable plotnine code. It is usable from any Agent that supports the Agent Skills standard
Introducing ggsql, a grammar of graphics for SQL that lets you describe visualizations directly inside SQL queries
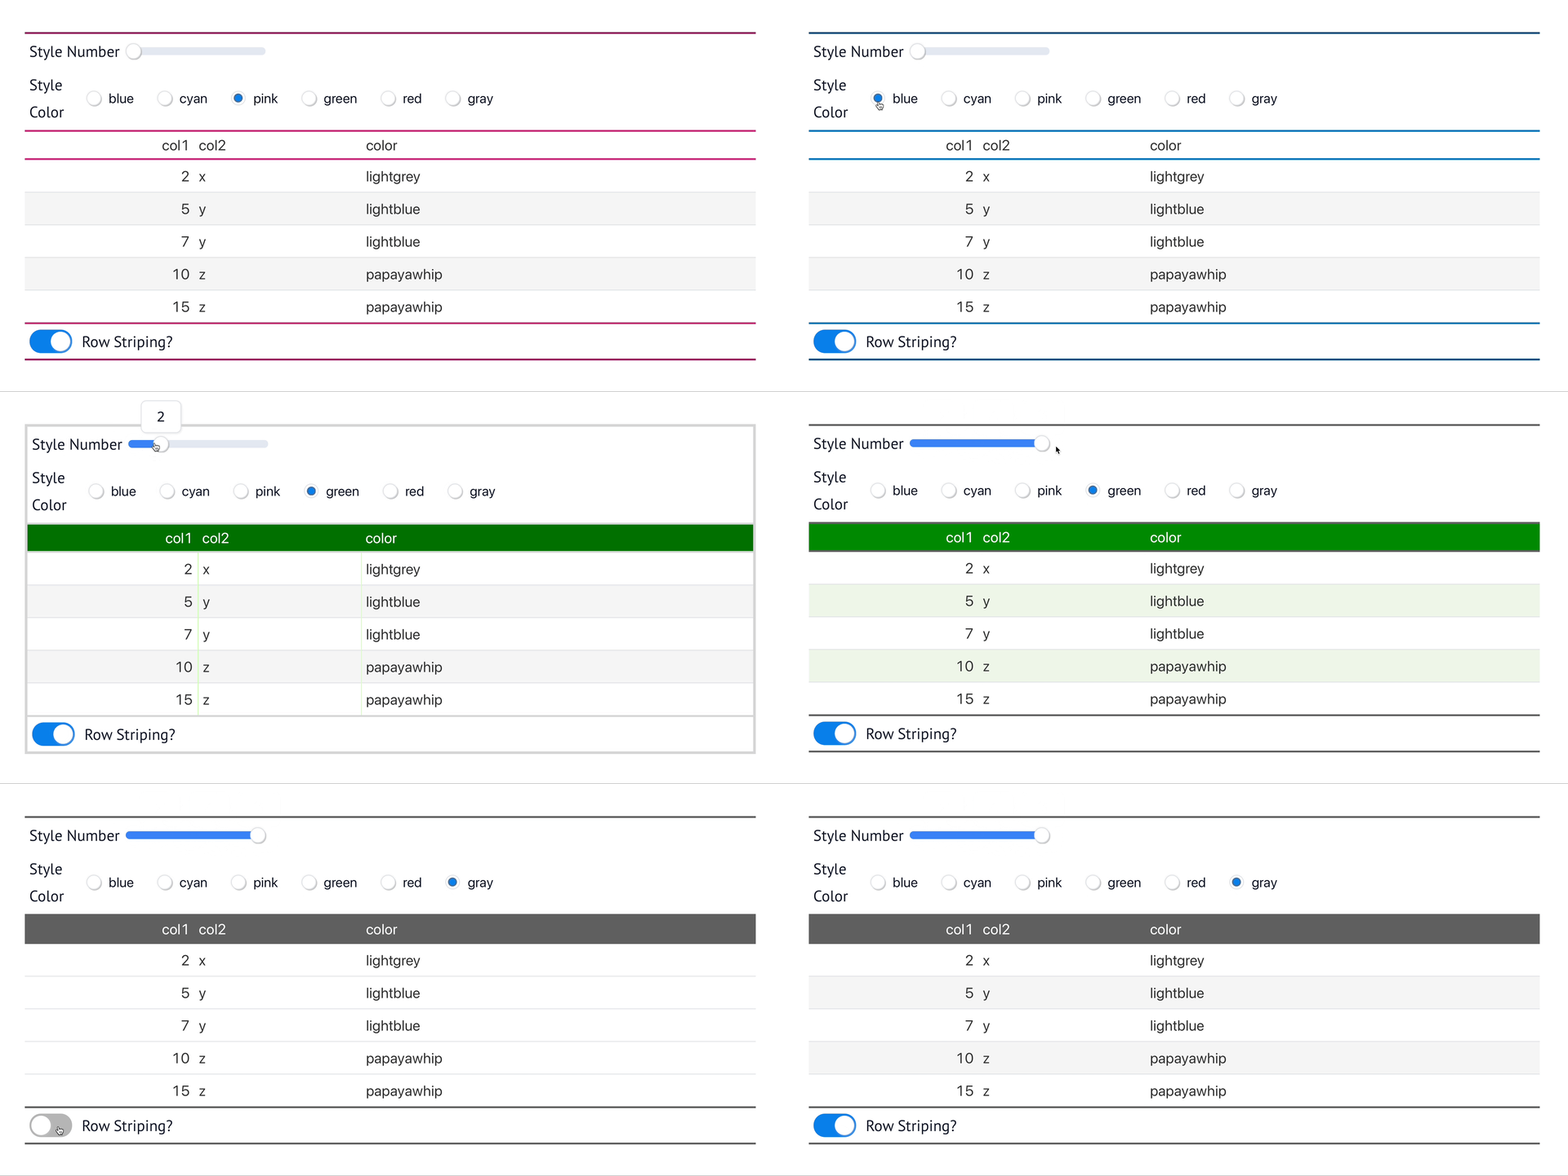
Learn to build complex table layouts in Great Tables: vertical text, column spanners, and zebra striping
This post discusses one function in ggplot2: theme(). Find out about the glamour of graphics in this deep-dive article
A new major version of ggplot2 has been released on CRAN. Find out what is new here

New in Great Tables v0.18.0: automatic column spanners with tab_spanner_delim(), boolean formatting, and rotated labels
Add sparklines and small charts to your Great Tables using svg.py, HTML, or plotnine
Make your Great Tables interactive with marimo’s reactive widgets
A new release of svglite has arrived, and with it full support for all the latest capabilities of the R Graphics Engine. Further, it finalizes the new approach to handling web fonts and font embedding in the created SVGs

The new 1.4.0 release of the scales package adds some colourful updates. Read about colour manipulation, palettes and new label functions
How Great Tables became Polars’ DataFrame.style—a look at open source collaboration
See how Great Tables powers Pointblank’s beautiful, shareable validation reports
Style table cells conditionally using Polars expressions with loc.body(mask=)
There has been a recent flurry of updates to packages involved in rendering text from R. This blog post will go through what this means for you as a user and developer
New in Great Tables v0.15.0: country flag icons with fmt_flag(), Font Awesome icons, and accounting notation
Working on transit data? Let’s collaborate on open source tools and standards
Add images anywhere in your Great Tables with fmt_image() and vals.fmt_image()
Create publication-ready PDF tables by exporting Great Tables to LaTeX
Plotnine v0.14.0: requires Python 3.10+, removes print() for rendering, and improves IDE support for scales
Great Tables v0.13.0 brings styling to all table locations via expanded loc.*() methods
New in Great Tables v0.12.0: Google Fonts via google_font() and zebra striping with opt_row_striping()
patchwork 1.3.0 has just been released bringing refinements to the free() function and full on support for gt tables
Final call for the 2024 Plotnine Contest—submit your best visualizations by July 26
Format scientific tables in Great Tables: unit notation, chemical formulas, and scientific notation
Why visualizing data matters: recreating Anscombe’s Quartet with Plotnine and Polars
The initial release brings markdown awareness to grid and ggplot2 to allow for rich text formatting in R graphics
Watch our PyCon 2024 talk on building publication-quality tables with Great Tables
Great Tables v0.5.0 makes Pandas optional—use Polars without pulling in extra dependencies
Why tables matter: 5,000 years of table design and how Great Tables solves the modern dilemma
New in Great Tables v0.4.0: nanoplots for tiny, interactive visualizations inside table cells
Introducing a new polar coordinate system that supersedes the old coord_polar(). Read on about the new coord_radial()
The 3.5.0 version of ggplot2 comes with an overhaul of the guide system. Read here what is new for axes
The 3.5.0 version of ggplot2 comes with an overhaul of the guide system. Read here what is new for legends
ggplot2 3.5.0 is now on CRAN. Discover what is new in this release
New in Great Tables v0.3.0: control column widths, style entire tables, and use system fonts
Use Polars and Great Tables to analyze which Super Bowl Squares give you the best odds
New in Great Tables v0.2.0: data_color() for automatic cell coloring based on values
Style Polars DataFrames for presentation using Great Tables and Polars expressions
A tour of the new Great Tables Python package — building structured tables, formatting cell values, applying targeted styles, and using Polars expressions for column selection
scales 1.3.0 is a minor release focusing on streamlining the API and gradual improvements of the existing utilities
ggplot2 3.4.0 is now on CRAN. Read all about the (mostly internal) changes that make up this release
scales 1.2.0 brings a number of small but useful improvements to numeric labels
In an upcoming webinar on November 17th, Solita will showcase how they successfully combined the strengths of RStudio and Tableau at one of Sweden’s largest government agencies
svglite 2.0.0 is now on CRAN. This is a huge feature release and part rewrite, and should excite anyone who cares about vector graphics. Read on to find out what is new!
We have recently updated some of our low-level graphics packages. Read on about what is new in ragg and systemfonts
Introducing gt v0.2: a grammar of tables for creating beautiful customized display tables in R
The next iteration of ggplot2 has just been released on CRAN, packed with new features and bug fixes. Read all about what’s new here
DT 0.4: editable tables, smart filtering, and shift-click row selection for Shiny apps
plotnine: a grammar of graphics implementation for Python built on matplotlib and pandas
leaflet 1.1.0 adds text labels, shape highlighting, awesome-markers, sf support, custom projections, and viridis palettes
svglite 1.2.0 improves font handling with system_fonts and user_fonts arguments, plus text scaling fixes
ggplot2 2.2.0 adds subtitles and captions, rewrites the facet system, improves theming, and fixes stacking order
DT 0.2 adds the Buttons extension, row/column/cell selection, and functions to modify tables without rebuilding
ggplot2 2.0.0: official extension mechanism, new geoms (geom_count, geom_curve, geom_label), appearance tweaks, and facet labels
svglite produces compact, web-optimized SVG graphics from R, with smaller file sizes and faster rendering than base R’s svg() device
Try adjusting your filters or search query.